The first two maps show the population distribution of African Americans in the United States according to the 2000 U.S. Census. From the two maps, it is apparent that the Black population is concentrated in the southeast region of the United States, with some counties that have as much as 86% of African Americans. This data makes sense considering the history of the South, but the maps also show that migration has taken place with people moving to northern parts of the United States.
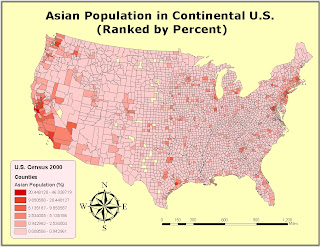
The next two maps show the population distribution of Asians in the United States with data taken from the 2000 U.S. Census. The maps have a less apparent trend but they show that Asians are mostly populated on the West Coast, especially in major cities in California with the highest percentage being 46%. This is understandable because the West Coast is the closest to Asian countries, and many have decided to stay there once they come to America.
The last two maps were created using data from the 2000 U.S. Census and they show the population distribution of "Some Other Race" ranked by percent. The maps show that people identified as "Some Other Race" are mostly populated in the southwest regions of the United States, with the highest percentage being 39%. I would suspect that they are Latin Americans due to the fact that Mexico is the neighboring country.
I have learnt a lot about what GIS is and how useful and applicable it is to analyze and solve real-life problems. Even though this is a very interesting subject, it is very challenging and my experiences with GIS were not always pleasant. There were lots of times when I got really frustrated with saving data at different places and having to redo the whole thing, but overall I enjoyed the class.


